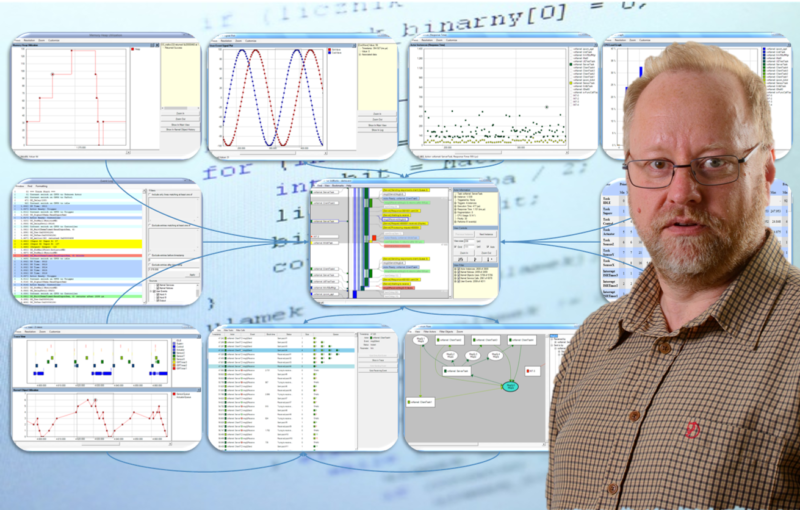
Tracealyzer for RTOS |
DevAlert |
|
Percepio DevAlert is a ground-breaking cloud service for IoT product organizations that provides awareness of missed bugs and speeds up resolution. DevAlert notifies the firmware developers within seconds after an error has been detected and provides diagnostic information about the issue, including a trace that shows you what was going on in your code when the error occurred. |
Book a free 45 minute consulting session with Senior FAE Niclas Lindblom. This is not a slideshow presentation. Video conference with Niclas to get started with Tracealyzer using your own project, tools, and hardware. Each session is unique. > Link to
A page of assorted Tracewalyzer Videos, Papers , case studies, 101 classes , specific topics and other resoirces is here
Check out this new series of Tracealyzer tutorial videos. They include everything from using STM32 CubeMX to create a project, configuring the trace library, debug probe, and STM32 Nucleo board, all the way using Tracealyzer to view the FreeRTOS trace data.. > Link to
Dr Chris Bridges and Pete Bartrum from Surrey Space Centre at Surrey University explain how they debug an ESEO satellite communications module for AMSAT running FreeRTOS using Percepio Tracealyzer
If sattalites are out of your reach then try Tracealyzer on somehting closer to earth: Drones. Tracealyzer has been used to develop Open Pilot Next Generation controll software. See here and the video below. Tracealyzer is used in demanding real time flight control
Percepio DevAlert is a ground-breaking cloud service for IoT product organizations that provides awareness of missed bugs and speeds up resolution. DevAlert notifies the firmware developers within seconds after an error has been detected and provides diagnostic information about the issue, including a trace that shows you what was going on in your code when the error occurred. > Link to
In collaboration with the FreeRTOS team, Percepio has developed FreeRTOS+Trace, the Tracealyzer for FreeRTOS and OpenRTOS. FreeRTOS+Trace visualizes run-time behaviour of your embedded software through more than 20 high-level views that complement the debugger perspective with the “big picture”. You may have used some trace tool before, but this is something extra. > Link to
Tracealyzer for VxWorks visualizes the run-time behaviour of your embedded software through more than 20 high-level views that complement the debugger perspective with the “big picture”. You may have used some trace tool before, but this is something extra. The views are interconnected in innovative ways and are very simple and intuitive to use, which makes Tracealyzer a very powerful analysis tool. > Link to
Tracealyzer for Linux uses the widely used LTTng tracing framework for recording the target system behaviour and support both the LTTng v2.x and the older LTTng version used in Wind River Linux 5. Since this is a pure software solution, you don’t need an advanced hardware trace debugger to use Tracealyzer. > Link to
Tracealyzer gives an unprecedented insight into On Time RTOS-32. Solve complex problems in a fraction of the time otherwise needed, develop more robust designs to prevent future problems and find new ways to improve your software’s performance. The improved understanding allows you to increase the overall software quality and reduce the troubleshooting time.. > Link to
Micrium µC/Trace gives an unprecedented level of insight into the run-time world of embedded software based on Micrium µC/OS-III. See our MICRIUM pages > Link to