- | Home |
- Company |
- Contact |
- News |
- S/ware Eng |
- Standards |
- Academic Support |
- Documents |
- Search |

- | Requirements |
- Compilers |
- Validation |
- RTOS |
- Analysis |
- Hardware |
- Software |
- Resources |
- Products |
- Platform |
Segger embOS-Trace

Percepio embOS-Trace gives an unprecedented level of insight into the run-time world of SEGGER embOS applications. This allows you to solve complex software problems in a fraction of the time otherwise needed, develop more robust designs to prevent future problems and find new ways to improve your software’s performance.
Multi-threaded software often has a complex behavior, where small changes in software timing may lead to unexpected behaviors. Timing-related problems are expensive as they manifest in late stages of testing, or worse, in deployed production code, and can be hard to reproduce. This risk is mitigated if the developers have a good insight into the software’s runtime behavior.
Percepio embOS-Trace, our Tracealyzer version for SEGGER embOS, visualizes the run-time behavior of your embedded software through 20+ graphical views that complement the code-level debugger perspective with the “big picture”. You may have used a tracing tool before, but the Tracealyzer visualization is on a new level. The views are interconnected in innovative ways and are very simple and intuitive to use, which makes Tracealyzer a very powerful analysis tool.
Tracealyzer provides an unprecedented insight that gives several high-level benefits in your product development. Solve complex software problems in a fraction of the time otherwise needed, develop more robust designs to prevent future problems and find new ways to improve your software’s performance. Tracealyzer facilitates validation, debugging, profiling, documentation and training.
Percepio embOS-Trace is designed for use with SEGGER J-Link debuggers and allow for continuous trace streaming on any J-Link debugger, for essentially unlimited durations. All you need is a SEGGER J-Link/J-Trace debug probe, an updated version of SEGGER embOS (version 4.06b or later) and our trace recorder library, included in the embOS-Trace installation. Percepio embOS-Trace uses software-defined trace, which makes it robust, flexible and easy to use. The events are written to a RAM buffer (a few KB) for temporary storage. The buffered events are then extracted by the SEGGER J-Link debugger via live memory reads, without interfering with executing system. The transfer is very fast and robust.
Like all Tracealyzer products, embOS-Trace offers a 30-day fully functional evaluation period and also includes a pre-recorded demo trace. The installer download will be made available , in early Q2 2015
|
|---|
The 20+ views include:
|
Tasks, System Calls and User Events
|
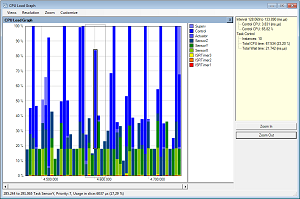 |
CPU Load
|
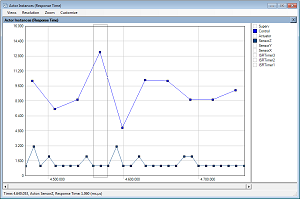 |
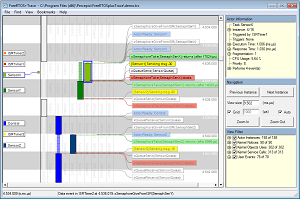
Timing Variations
|
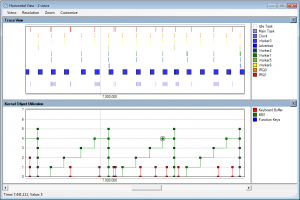 |
Show Multiple Views Synchronized
|
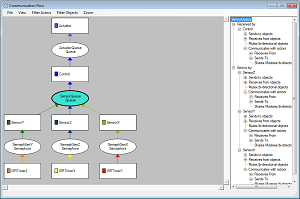 |
Communication Flow
|
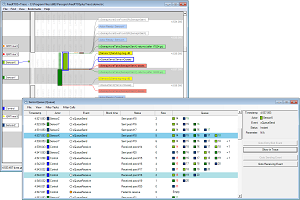 |
Kernel Object History
|
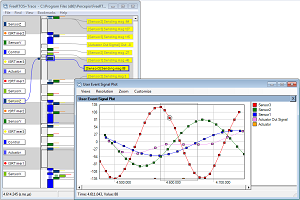 |
User Events and Signal Plots User-defined events, or User Events, allow you to log any event or data in your embedded application. This gives the flexibility of classic debug “printf” calls, but much faster as all string formatting is done offline. Since you get the events on the same time-line as the kernel trace, it is easy to correlate the application event with the other views. Data arguments can be stored together with labels, and plotted to visualize the data. The plotting is highly useful for analysis of control algorithms, as it allows you to correlate the plotted data with the other time-line views to find the cause of any anomalies in the plot. |
embOS+Trace relies on a trace recorder library for embOS developed by Percepio, in partnership with the embOS team at Segger GmbH. The recorder library is delivered in C source code and included in the embOS+Trace application directory. A link to the recorder folder is available in the Help menu. It is easy to integrate using the guide in the user manual.