Tracealyzer for VxWorks

Tracealyzer for VxWorks gives an unprecedented level of insight into the run-time world of embedded software based on Wind River VxWorks. This allows you to solve complex software problems in a fraction of the time otherwise needed, develop more robust designs to prevent future problems and find new ways to improve your software’s performance.
When developing embedded software based on an operating system, a traditional debugger is often insufficient to fully understand the software’s run-time behavior. A debugger shows the current system state and allows you to step through individual functions, but this is a low-level perspective that is not suitable for studying real-time operating system behavior, such as scheduling, blocking and interactions between tasks.
Tracealyzer for VxWorks visualizes the run-time behavior of your embedded software through more than 20 high-level views that complement the debugger perspective with the “big picture”. You may have used some trace tool before, but this is something extra. The views are interconnected in innovative ways and are very simple and intuitive to use, which makes Tracealyzer a very powerful analysis tool.
Tracealyzer provides an unprecedented insight into the run-time world of your system, that gives several high-level benefits in your products development. Solve complex software problems in a fraction of the time otherwise needed, develop more robust designs to prevent future problems and find new ways to improve your software’s performance.
Tracealyzer for VxWorks reads the data from the built-in trace recorder in VxWorks (wvLib) and is compatible with all VxWorks versions from v5.5 and forwards. Since this is a pure software solution, you don’t need an advanced hardware trace debugger to use Tracealyzer.
Tracealyzer can be used as a lab tool but also for post-mortem analysis. Some customers keep the recording active in their release build, which gives them very valuable trace diagnostics on real-world issues that otherwise would have been hard to analyze. The trace recorder in VxWorks (wvLib) can be configured as a “flight recorder”, that keeps the latest event history in a RAM ring-buffer, or to continuously store the trace to the device file system or stream it directly to the development computer. Since the VxWorks recorder can be controlled from the embedded application or from a target console, it is not required to have Wind River Workbench installed to use Tracealyzer for VxWorks.
Percepio provides a small library that extends wvLib with formatted printf style User Events, which allows for plotting of logged data arguments in Tracealyzer. This extension library is delivered in C source code and included in the Tracealyzer for VxWorks application directory.
The 20+ views include:
 |
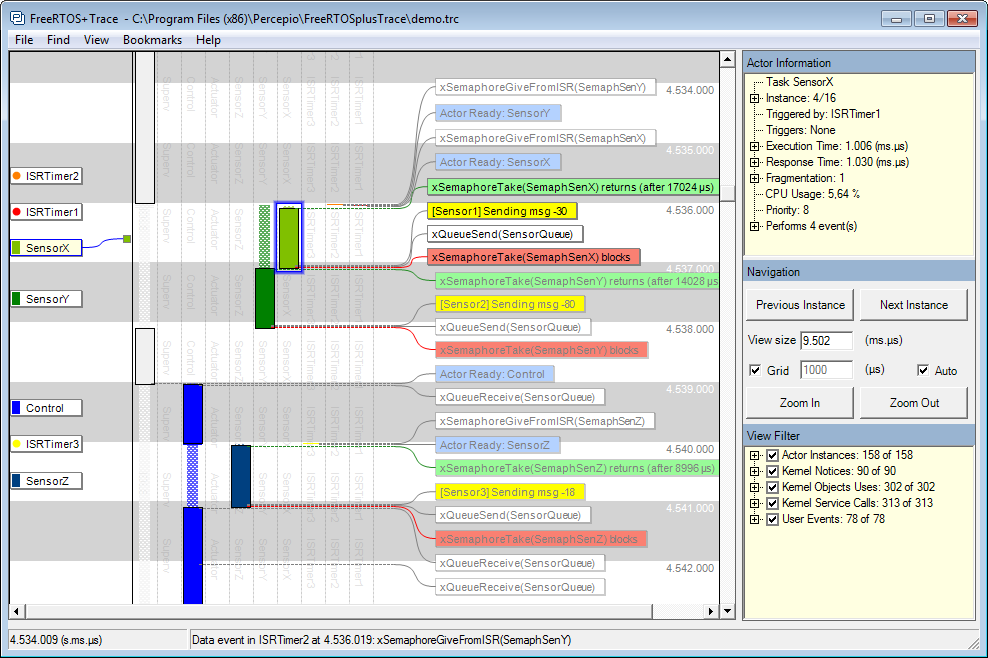
Tasks, System Calls and User Events
The main trace view shows you all recorded events visualized on a vertical time-line, including task execution timing, interrupts, system calls and custom user events. The task and interrupt trace are shown as colored rectangles. Events are shown as floating text labels. Zooming is very easy using a click-and-drag selection, which also works as a measurement tool. Tasks and events can be clicked and highlighted for additional information, including timing and event dependencies. The lower right corner contains a powerful filter, and the Finder dialog provides even more powerful filters. When zooming out, this view naturally transforms into an overview where patterns can be studied. |
 |
CPU Load
This view presents a horizontal time-line showing the total CPU usage, and also CPU usage per task/interrupt. The CPU Load Graph allows for navigating the main trace view, since a double click in the CPU Load Graph focuses the main trace view on the clicked interval. Zooming is allowed in this view as well, independently of other views, and filters are available for focusing on individual tasks or interrupts. |
.png) |
Timing Variations
This is an example of several Actor Instance Graphs, each showing the distributions of a specific timing property for an actor, i.e., a task or interrupt routine. This includes execution time, response time, fragmentation, and several others. Each data point represents one specific execution of a task or interrupt handler. This graph, Response Time, shows the variation in response times for two selected tasks. Tasks instances with high response times may reveal resource conflicts, e.g., where several tasks or interrupts compete for CPU time in a busy interval. This view makes it easier to spot such locations that may indicate problems or possibilities for optimization. |
 |
Show Multiple Views Synchronized
All views with horizontal orientation can be combined in a single parent window, with synchronized scrolling. This includes most views except the main trace view, but the task and interrupt trace is available as a horizontal view as well. In this example, the CPU Load Graph is shown together with a plot of task response times. Combining views like this allows for spotting patterns that otherwise would be hard to see using individual views, e.g., how the response time depends on other events, and this also allows for greater customization of the user interface. |
 |
Communication Flow
Many system calls allow for communication or synchronization between tasks. Tracealyzer for VxWorks understand these dependencies and the Communication Flow graph is a summary of all such dependencies found in the trace, in the form of a directed graph. This is a high-level view of the communication dependencies between tasks and interrupts, including the kernel objects used such as semaphores and message queues. Like in all views, double-clicking on a node opens a related view focused on the particular object. Double-clicking on a kernel object (e.g., a semaphore) opens the Object History view (shown below), a list of all events on the specific kernel object. If double-clicking on a task or interrupt, the Actor History view is opened showing all executions of the actor. |
 |
Kernel Object History
This view shows all events on a particular kernel object, such as a message queue, semaphore or mutex. The events are presented as a list, and double-clicking on a list item shows the corresponding system call in the main trace view. For message queues and similar objects with send/receive operations, it is possible to follow a specific message from send to receive, or vice versa, and also to inspect the messages (by sequence number) in the queue at any given time. |
 |
User Events and Signal Plots
User-defined events, or User Events, allows you to log any event or data in your embedded application. This gives the flexibility of classic debug “printf” calls, but are much faster as all string formatting is done offline, in the viewer. Since you get the events on the same time-line as the kernel trace, it is easy to correlate the application event with the other views. Data arguments can be stored together with labels, and plotted to visualize the data. The plotting is highly useful for analysis of control algorithms, as it allows you to correlate the plotted data with the other time-line views to find the cause of any anomalies in the plot. |
| |
|